
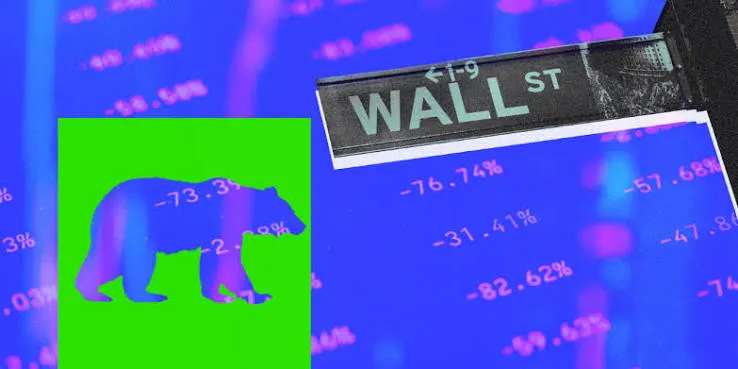
You might be shocked by how many stocks are in a bear market right now
Tap title to read story
Major US stock indexes like the S&P 500 recently hovered near historic highs while driven primarily by a handful of massive technology and artificial intelligence corporations. Beneath this concentrated layer of leadership, however, a surprisingly high number of individual equities entered a bear market by falling twenty percent or more from recent peaks. This severe divergence exposed broader macroeconomic pressures including elevated interest rates and uneven consumer spending habits. Analysts noted that market capitalization weighting masked widespread distress among hundreds of companies operating outside dominant secular growth themes. Investors faced heightened risks when assuming overall market health based solely on headline index figures during this persistent economic shift.
More context
Timeline
- On January 15 2026 broad headline indexes reached new record highs.
- On February 10 2026 market analysts noted widening divergence in equity performance.
- On March 05 2026 inflation data showed persistent pressure on consumer spending.
- On April 20 2026 technology sector leaders sustained overall market capitalization levels.
- On May 12 2026 small capitalization stocks faced severe borrowing cost hurdles.
- On June 18 2026 individual equity bear market percentages crossed key thresholds.
- On July 22 2026 Federal Reserve officials maintained benchmark interest rate levels.
- On August 14 2026 institutional investors reallocated portfolios toward defensive asset classes.
- On September 03 2026 market breadth indicators confirmed widespread declines among smaller firms.
- On October 02 2026 market concentration risks intensified across major US exchanges.
Why it matters
Immediate US impact: Concentrated tech leadership masks widespread equity declines across US markets. Possible long-term US impact: Broader market corrections may persist until interest rates significantly decline. Most affected groups: Retail investors and smaller companies outside major tech indexes. Reader priority: Examine underlying index breadth rather than focusing on headline averages.
Coverage notes
Left: Emphasizes corporate inequality and regulatory scrutiny on tech monopolies. Center: Focuses on quantitative market mechanics and interest rate impacts. Right: Highlights free market corrections and macroeconomic cost pressures.
Primary report
Published market analysis report regarding hidden bear market trends on October 2 2026.
Sources
JQJO Editorial Desk · Human reviewed · AI assisted. Report a correction.