
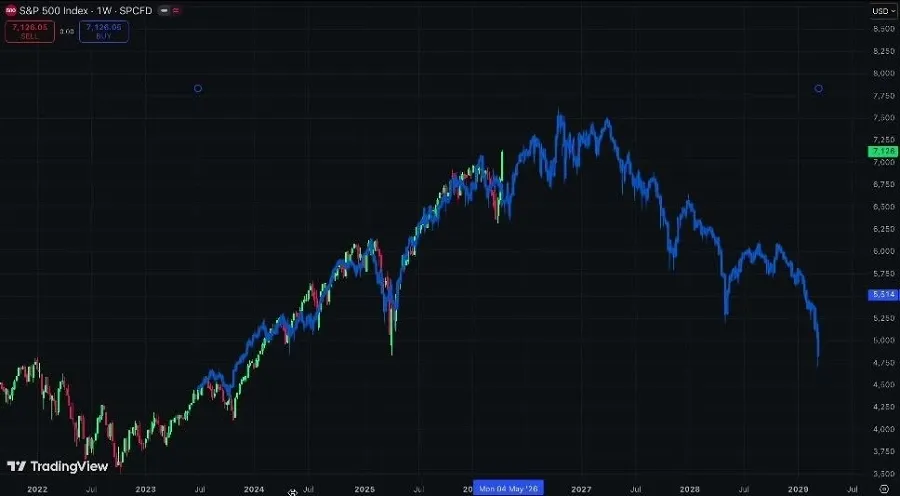
AI Bubble Crash Fears Mount as S&P 500 Cape Ratio Matches Dot-Com Peak
Tap title to read story
The cyclically adjusted price-to-earnings (CAPE) ratio for the S&P 500 has climbed past 40, matching valuation thresholds last sustained during the height of the 2000 dot-com bubble. This market benchmark, developed by economist Robert Shiller to average inflation-adjusted earnings across a ten-year cycle, marks only the second time in 155 years that the metric has remained at these elevated levels for consecutive months. The extended valuation surge is driven heavily by capital investments and market concentration in artificial intelligence infrastructure. Financial institutions note that the top ten companies in the S&P 500 account for approximately 40% of the index's total value, significantly exceeding the peak concentration levels recorded during previous market cycles. Economists continue to monitor these metrics for potential portfolio vulnerabilities tied to technology sector valuations.
More context
Timeline
- On January 1 1999 The S&P 500 Shiller CAPE ratio first breached 40 during the dot-com era.
- On December 1 1999 The historical CAPE record peak of 44.2 was reached ahead of the dot-com market correction.
- On May 1 2026 The S&P 500 Shiller CAPE ratio held above 40 for consecutive months, mirroring historical extremes.
- On September 1 2026 Economic datasets placed the Shiller CAPE ratio at approximately 40.68.
- On October 1 2026 Upcoming Q3 corporate earnings and capital expenditure reports for major technology index components.
Why it matters
Immediate US impact: High equity market concentration increases portfolio sensitivity to sudden valuation shifts across major U.S. technology sectors. Possible long-term US impact: Extended periods of elevated CAPE valuations have historically preceded protracted intervals of compressed market returns. Most affected groups: Index mutual fund investors, institutional asset managers, and corporate technology stakeholders. Reader priority: Monitor corporate guidance updates and capital expenditure disclosures from major index components.
Coverage notes
News is Factual Everywhere
Primary report
Reporting on the S&P 500 Shiller CAPE ratio approaching historic dot-com valuation peaks.
Sources
JQJO Editorial Desk · Human reviewed · AI assisted. Report a correction.